
Consumer insolvency rates by Alberta region, 2024
Alberta’s overall consumer insolvency rate of 5.1 per 1,000 adults in 2024 puts it fifth among provinces. Above average, but unremarkable.
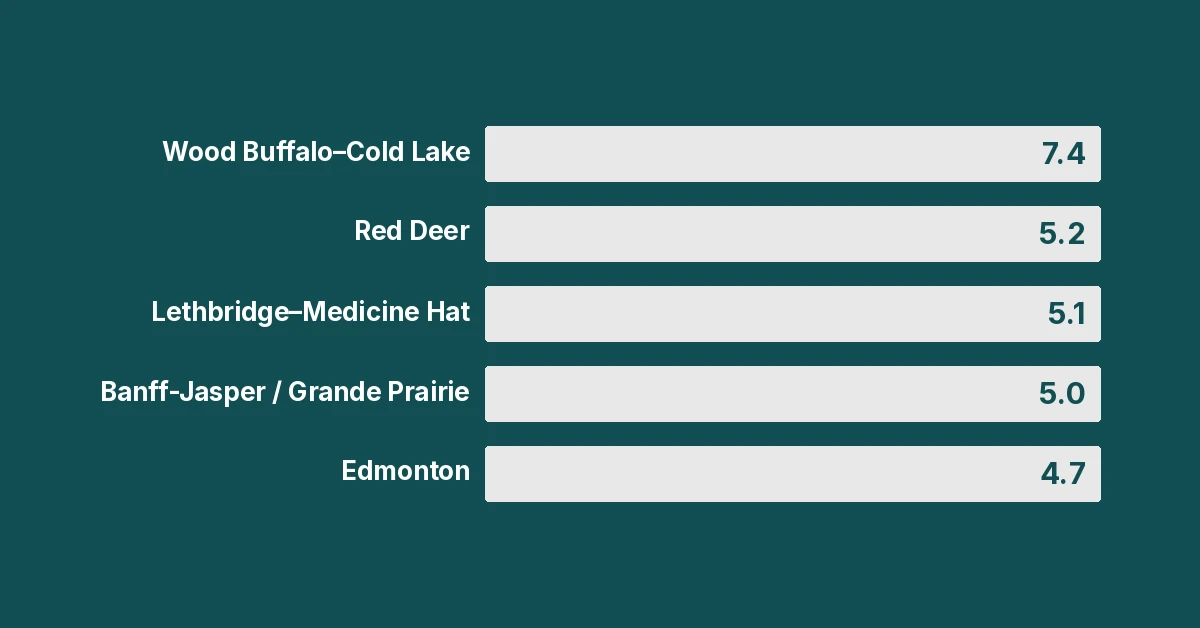
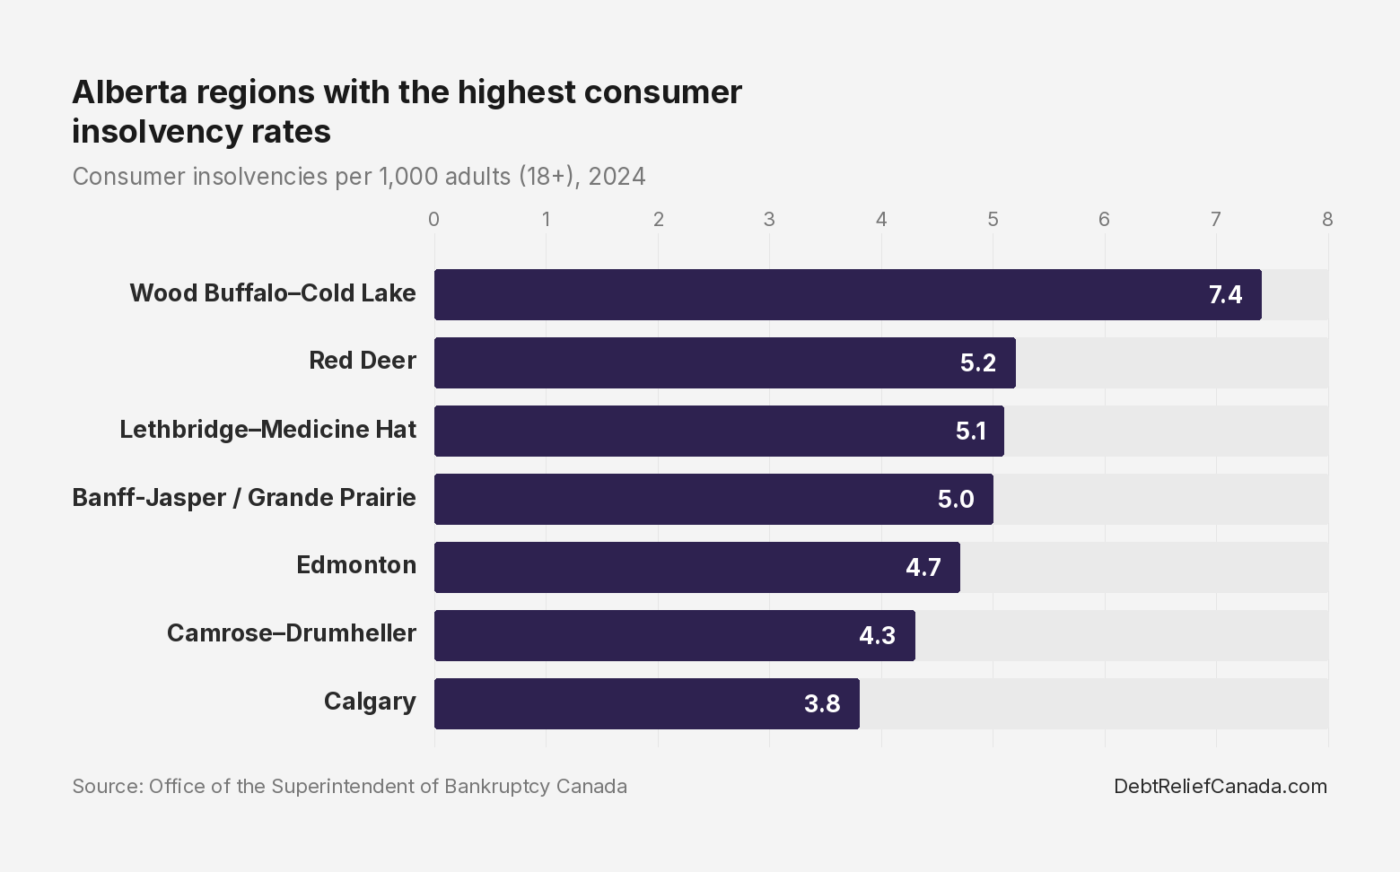
The spread within Alberta tells a completely different story. Wood Buffalo-Cold Lake, the Fort McMurray region, has a consumer insolvency rate of 7.4. Calgary’s is 3.8.
Same province, same laws, same access to Licensed Insolvency Trustees, and nearly double the rate.
That 7.4 is the highest consumer insolvency rate of any economic region tracked by the OSB in the country. Higher than Cape Breton (6.8), higher than Greater Sudbury (5.8 at the CMA level), and higher than anywhere in Atlantic Canada.
The following table shows consumer insolvency rates per 1,000 adults (aged 18 and older) for each economic region in Alberta, as tracked by the Office of the Superintendent of Bankruptcy. Rates include both consumer proposals and bankruptcies.
| Region | Insolvency rate | Bankruptcy rate | Proposal rate |
|---|---|---|---|
| Wood Buffalo-Cold Lake | 7.4 | 0.8 | 6.6 |
| Red Deer | 5.2 | 0.8 | 4.5 |
| Alberta (provincial average) | 5.1 | 0.7 | 4.4 |
| Lethbridge-Medicine Hat | 5.1 | 0.8 | 4.4 |
| Banff-Jasper and Grande Prairie-Peace River | 5.0 | 0.7 | 4.3 |
| Edmonton | 4.7 | 0.7 | 4.0 |
| Camrose-Drumheller | 4.3 | 0.5 | 3.7 |
| Calgary | 3.8 | 0.5 | 3.2 |
Economic region definitions come from Statistics Canada. The Banff-Jasper-Rocky Mountain House ER and Athabasca-Grande Prairie-Peace River ER have been combined since 2014.
Why Fort McMurray leads the province
Wood Buffalo-Cold Lake has climbed every year since 2020: 5.2, 6.0, 6.7, 6.9, and 7.4. A 42% increase in four years.
The oil patch explains it. High incomes during booms mean heavy borrowing on trucks, housing, and recreation vehicles. When oil prices drop, those payments don’t shrink with the paycheque, and suddenly the math stops working.
As of Q2 2025, Alberta has the highest average non-mortgage consumer debt of any province.
Source: Equifax Canada – Q2 2025 Market Pulse Consumer Credit Trends
The proposal rate in Wood Buffalo-Cold Lake (6.6) tells you something. These are not destitute people. They’re filing consumer proposals, not going bankrupt.
They earn enough to make a deal with creditors, but the debt load has become unmanageable. Wood Buffalo’s proposal rate alone is higher than the total insolvency rate in every single economic region in British Columbia.
The Calgary-Edmonton gap
Calgary (3.8) and Edmonton (4.7) are both major metros with diversified economies beyond oil and gas. Edmonton’s insolvency rate is 24% higher.
Edmonton’s rate has risen steadily since 2020: 3.9, 3.9, 3.9, 4.5, 4.7. Calgary has barely moved: 3.5, 3.4, 3.4, 3.9, 3.8. Two cities in the same province, two different trajectories.
At the CMA level, the numbers are similar. The Edmonton CMA rate is 4.6, and the Calgary CMA rate is 3.8. Lethbridge’s CMA rate of 5.4 is actually higher than the Lethbridge-Medicine Hat economic region rate of 5.1 because Medicine Hat pulls the ER average down slightly.
For a full national comparison of city-level rates, see Which Canadian City Has the Highest Insolvency Rate?
Five-year trend by region, 2020 to 2024
| Region | 2020 | 2021 | 2022 | 2023 | 2024 | Change |
|---|---|---|---|---|---|---|
| Wood Buffalo-Cold Lake | 5.2 | 6.0 | 6.7 | 6.9 | 7.4 | +42% |
| Banff-Jasper and Grande Prairie-Peace River | 3.5 | 4.4 | 4.1 | 4.7 | 5.0 | +43% |
| Camrose-Drumheller | 3.1 | 4.0 | 4.1 | 4.0 | 4.3 | +39% |
| Alberta (provincial average) | 3.8 | 3.9 | 4.3 | 5.0 | 5.1 | +34% |
| Edmonton | 3.9 | 3.9 | 3.9 | 4.5 | 4.7 | +21% |
| Lethbridge-Medicine Hat | 4.4 | 4.4 | 4.9 | 5.4 | 5.1 | +16% |
| Red Deer | 5.1 | 5.4 | 5.2 | 6.5 | 5.2 | +2% |
| Calgary | 3.5 | 3.4 | 3.4 | 3.9 | 3.8 | +9% |
What the trends show
Wood Buffalo (+42%) and the Banff-Jasper and Grande Prairie-Peace River region (+43%) had the steepest climbs in the province. Calgary’s 9% increase over five years is the smallest among Alberta regions.
Red Deer spiked to 6.5 in 2023, then dropped back to 5.2 in 2024. The data doesn’t explain why.
One caveat on all these percentages. The 2020 base year was not normal. COVID suppressed insolvency filings everywhere, so percentage increases measured from 2020 are inflated.
How Albertans file: proposals dominate
Alberta’s consumer insolvency numbers for the full year 2025 tell a clear story about how people deal with debt in this province.
Out of 18,876 consumer insolvencies, 16,261 were consumer proposals, and 2,615 were bankruptcies. That is a proposal-to-bankruptcy ratio of 6.2 to 1. The national average is roughly 3.6 to 1.
Why so high? Alberta has Orderly Payment of Debts, a program not available in Ontario, British Columbia, or Quebec. Higher incomes in the oil and gas sector mean more people qualify for consumer proposals rather than bankruptcy.
You need income to service a consumer proposal, and it’s clear that many Albertans have enough income to do so.
Alberta’s consumer insolvencies dropped 0.6% in 2025 compared to 2024. Nationally, consumer insolvencies rose 2.3% to 140,457.
For a comparison of how Alberta stacks up against other provinces, see Which Canadian Province Has the Highest Insolvency Rate?
What the numbers don’t tell you
These rates only capture formal insolvency filings. They don’t include people using informal debt settlement, debt management plans through credit counselling services, or people struggling but not yet filing.
An Ipsos survey conducted for MNP LTD in June 2025 found that 47% of Albertans are $200 or less from financial insolvency each month. That is the highest of any province. About 30% said they are already insolvent.
Source: MNP LTD – Consumer Debt Index, Q2 2025
Equifax Canada reported Alberta’s non-mortgage delinquency rate at 1.98% in Q2 2025, well above the national average of 1.60%. Within Alberta, Fort McMurray, Edmonton, and Calgary all saw rising delinquency rates, with Fort McMurray’s increase the steepest in the province at 37.1 basis points year over year.
Source: Equifax Canada – Q2 2025 Market Pulse Consumer Credit Trends
The gap between “in financial trouble” and “filed for insolvency” is where most Albertans carrying heavy debt actually sit. The OSB numbers are the tip of the iceberg.
Methodology and sources
Consumer insolvency rates are published annually by the Office of the Superintendent of Bankruptcy. The rate is calculated as consumer insolvencies per 1,000 population aged 18 years and older.
Economic region (ER) boundaries come from Statistics Canada. ERs are larger than Census Metropolitan Areas and cover the entire province, including rural areas that CMAs miss. That is why Wood Buffalo-Cold Lake, which is not a CMA, only appears in the ER data.
The most recent annual ER rates available are for 2024, while provincial totals for 2025 come from the OSB’s Q4 2025 quarterly report. When the OSB publishes 2025 ER rates (expected mid-2026), this article will be updated.
Frequently asked questions
Which part of Alberta has the highest insolvency rate?
Wood Buffalo-Cold Lake, the economic region that includes Fort McMurray, had the highest consumer insolvency rate in Alberta in 2024 at 7.4 per 1,000 adults. That is also the highest rate among Canada’s economic regions, nearly double Calgary’s rate of 3.8.
What is Calgary’s insolvency rate?
Calgary’s consumer insolvency rate in 2024 was 3.8 per 1,000 adults. That is the lowest among all economic regions in Alberta. Calgary’s rate has barely changed over five years, rising just 9% from 3.5 in 2020 to 3.8 in 2024.
What is Edmonton’s insolvency rate?
Edmonton’s consumer insolvency rate in 2024 was 4.7 per 1,000 adults at the economic region level and 4.6 per 1,000 adults at the CMA level. Edmonton’s rate has risen steadily from 3.9 in 2020, a 21% increase over four years. Edmonton’s insolvency rate is 24% higher than Calgary’s.
Why is Fort McMurray’s insolvency rate so high?
Fort McMurray sits in the oil patch, where boom-and-bust cycles drive up both incomes and borrowing. High earnings during booms mean people qualify for large vehicle loans, mortgages and lines of credit. When the industry contracts, the payments don’t shrink. Alberta has the highest average non-mortgage consumer debt of any province, and northern Alberta carries even more.
Do most Albertans file consumer proposals or go bankrupt?
Consumer proposals outnumber bankruptcies in Alberta by 6.2 to 1, based on full-year 2025 data. That is nearly double the national ratio of about 3.6 to 1. In Wood Buffalo-Cold Lake, the proposal rate alone (6.6 per 1,000 adults) is higher than the total insolvency rate in most regions.
How does Alberta compare to other provinces?
Alberta’s overall consumer insolvency rate of 5.1 per 1,000 adults in 2024 puts it fifth among provinces. Nova Scotia (5.1), New Brunswick (5.2), and Newfoundland and Labrador (5.0) are in the same range. British Columbia (2.7) and Ontario (4.1) are lower.
For a full comparison, see Which Canadian Province Has the Highest Insolvency Rate?
What is the difference between an economic region and a CMA?
An economic region covers an entire geographic area, including rural communities and small towns. A Census Metropolitan Area only captures cities with an urban core of at least 100,000 people.
Fort McMurray does not qualify as a CMA, so it only appears in the ER-level data. That is why the city-level insolvency data published by the OSB misses the region with the highest rate in the country.
Are Alberta insolvency rates still rising?
Alberta’s provincial insolvency rate was essentially flat from 2024 to 2025, dropping 0.6% while the national average rose 2.3%. But the provincial average hides regional variation. Wood Buffalo-Cold Lake has increased every year since 2020, from 5.2 to 7.4. Whether 2025 ER-level data shows that streak continuing is not yet known.
Talk to a Licensed Insolvency Trustee
If you’re in Alberta and carrying debt you can’t manage, a Licensed Insolvency Trustee can walk you through your options. The initial consultation is free and confidential.